Software optimization for performance, energy, and thermal distribution: Initial case studies
Md Ashfaquzzaman Khan, Can Hankendi, Ayse Kivilcim Coskun, Martin C. Herbordt
We made a program run faster by adding more synchronization overhead. That result stopped us cold when we first saw it. The instinct in parallel computing is to minimize coordination between threads, to let each core charge ahead with as little waiting as possible. But when we restructured the dedup benchmark using task decomposition with explicit spinlock synchronization, performance scaled past the default implementation at 6 threads while simultaneously consuming less power and running cooler. All three metrics improved together, which is not supposed to be easy.
TL;DR
- Task decomposition improved scaling from ~3x to ~4.5x at 6 threads, while the default implementation collapsed to ~3x after peaking at 4 threads
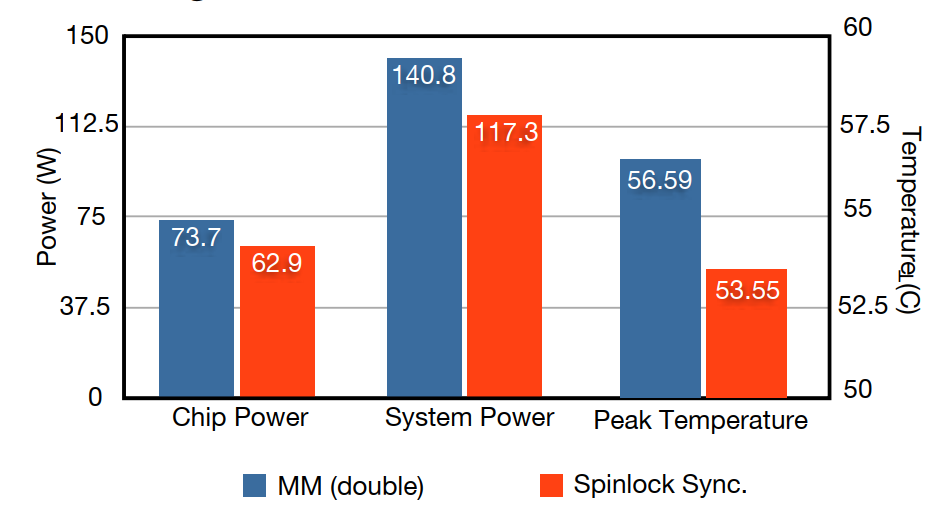
- Chip power dropped from 73.7W to 62.9W with the restructured version, a 15% reduction
- System power fell from 140.8W to 117.3W, a larger relative drop because cooling load also decreased
- Peak temperature dropped from 56.59°C to 53.55°C, roughly 3 degrees, which sounds small but matters for cooling infrastructure
- A 3-degree temperature reduction translated to measurable system-level energy savings because cooling power is nonlinear with temperature
- Our regression-based power model stayed within ~6% error across the full PARSEC benchmark suite
The Core Insight
Parallel performance problems are usually framed as throughput problems: get more work done per unit time. But throughput is only one dimension of the problem. The question we kept returning to was: what is the software actually doing to the hardware when it runs? Not just "how fast," but where is the energy going, and what does the thermal profile look like across the die?
The uncomfortable truth is that a program can be "fast" in wall-clock terms while being thermally and energetically inefficient in ways that create serious downstream costs. Cooling is not free. Hot spots degrade reliability. And the relationship between chip power and system power is not linear: when you reduce chip power by 10W, system power can fall by more than 10W because the cooling infrastructure responds to the thermal load.
Our hypothesis was that optimizing software for Performance, Energy, and Temperature (PET) jointly is a different problem from optimizing for any two of them. The dedup case study is the clearest evidence we have for that claim so far.
The Experimental Story
What happened with dedup
The default dedup implementation from the PARSEC benchmark suite uses a pipeline parallelism model. It looked reasonable on the surface: at 4 threads, scaling hit about 3.6x. We expected it to continue climbing. Instead it fell sharply to ~1.8x at 5 threads, then recovered to ~3x at 6 threads. That jagged line is a red flag. It signals load imbalance, synchronization contention, or both.
We restructured dedup using task decomposition, assigning distinct work units to threads more explicitly and using spinlock-based synchronization at key points. The expectation before running it was that the added synchronization overhead would hurt. It did not.
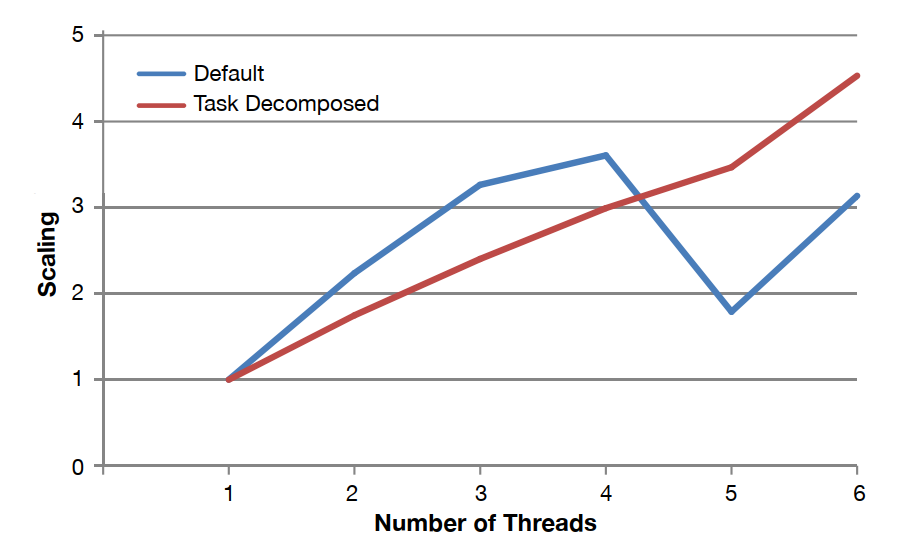
The task-decomposed version scaled smoothly and reached 4.5x at 6 threads. More importantly, it did this while consuming less power. The default version at peak load was drawing 73.7W at the chip. The restructured version: 62.9W. The better-performing program was also the lower-power program. That combination is not automatic. It happened here because the task decomposition eliminated the pipeline stalls and resource contention that were forcing cores to spin or wait, burning cycles without doing useful work.
What the temperature result tells us about cooling
The second case study started from a different question: if we can reduce chip temperature by a few degrees through software restructuring, does that actually move the needle on system energy? The conventional wisdom says chip power is the metric that matters; temperature is a consequence, not a lever.
We found that perspective is incomplete. When we compared workloads with different thermal profiles, a 3-degree reduction in peak temperature (56.59°C to 53.55°C) corresponded to a system power reduction from 140.8W to 117.3W, a drop of more than 23W at the system level even when chip-level differences were smaller.
The key insight is that cooling infrastructure responds to thermal load. When chip temperature drops, the energy required to maintain safe operating temperatures drops too, and that effect compounds. A few degrees is not a rounding error. It is a meaningful reduction in the total cost of running the workload.
How It Works
We needed to measure power and temperature at a granularity that standard tools do not provide. Most servers expose chip-level or system-level power, not per-core power. To build a per-core power model, we designed a suite of six microbenchmarks, each targeting a different CPU subsystem: floating-point units, integer units, memory bandwidth, shared cache access, synchronization-heavy memory access, and branch prediction.
We ran these benchmarks while simultaneously collecting hardware performance counter data and direct power measurements via a Hall-effect clamp ammeter on the 12V input lines to the voltage regulator. We then fit a linear regression model using eight hardware events (including CPU clock cycles unhalted, retired micro-ops, L2 cache misses, and FPU dispatches) to predict per-core power from performance counter data. The model includes a constant term of 28.1 that captures standby idle power.
The L2 cache miss coefficient stands out at 695.9, orders of magnitude larger than the other terms. This reflects a physical reality: a cache miss that forces a DRAM access is dramatically more expensive in energy terms than a cache-resident operation. Software that reduces cache pressure does not just run faster; it consumes meaningfully less energy per instruction.
Thermal modeling used HotSpot 5.0, fed with power traces from our regression model. We extracted die dimensions from chip documentation to construct a layout-accurate thermal model. This gave us per-core temperature estimates that the on-chip sensors alone cannot provide.
Key Results
- ✓4.5x scaling at 6 threads for task-decomposed dedup vs. ~3x for default: the restructured version outperformed the original at every thread count above 4
- ✓15% reduction in chip power (73.7W to 62.9W): better performance with less energy, simultaneously
- ✓16.7% reduction in system power (140.8W to 117.3W): the system-level gain exceeded the chip-level gain due to reduced cooling demand
- ✓~3°C peak temperature reduction (56.59°C to 53.55°C): small in absolute terms, significant in its effect on system energy
- ✓Power model error under 6% across the PARSEC suite: accurate enough to make software-level PET decisions without dedicated hardware instrumentation on every machine
Takeaways
We are confident that software structure directly affects all three of Performance, Energy, and Temperature, and that optimizing for one does not automatically improve the others. The dedup result is the clearest illustration: the default implementation was not poorly written, but it had contention patterns that burned energy without delivering proportional performance.
We are also confident that system-level energy is the right metric, not chip power alone. The gap between 73.7W and 62.9W at the chip translates to a gap between 140.8W and 117.3W at the system. Ignoring cooling in your energy accounting is ignoring a substantial fraction of the actual cost.
What remains open is whether these results generalize. Two case studies on one 12-core AMD platform is a starting point, not a conclusion. We do not yet have guidelines broad enough to tell a developer "restructure your application this way and expect X% energy reduction." That is the longer-term goal.
The thing worth remembering: the program that minimizes wasted work at the hardware level tends to win on all three dimensions at once. Performance, energy, and temperature are not independent knobs. They share the same underlying cause, which is how efficiently the software uses the hardware it runs on.