Optimizing Workload Migration for Carbon and Cost Reductions Under Grid Constraints: New Insights and a Practical Evaluation Framework
Can Hankendi, Ayse K. Coskun
Migrating to the cheaper, greener grid region sounds straightforward. It almost always is, unless that region is already stressed, in which case you just traded your carbon footprint for someone else's grid instability. That tension is what our framework is built around, and the result that forced us to rethink everything is this: optimizing purely for cost can actually increase grid strain violations by nearly 7x compared to our constrained approach, even when the cost savings look great on paper.
TL;DR
- Up to 15% cost reduction and 13% carbon reduction are achievable simultaneously through cross-regional workload migration, without violating grid safety thresholds.
- The single best migration path we found: NYISO to SPP delivers 55.9% cost reduction. The worst: SPP to NYISO costs 132.8% more.
- Cost-only optimization produces 18% cost savings but generates 14% grid strain violations. Our constrained method gets 15% cost savings with only 2% violations.
- Weighting toward carbon (α=0, β=1) consistently improves carbon reduction across all ISOs, with ISO-NE reaching 12% carbon reduction, but it comes at the cost of lower dollar savings.
- Seasonal timing matters. Summer migrations yield different tradeoffs than winter ones, and ignoring that temporal structure leaves savings on the table.
The Uncomfortable Truth About "Green" Migration
The naive framing of workload migration goes like this: find the cheapest or cleanest grid, send the job there, done. The problem is that every workload you migrate into a destination region increases that region's load. If the grid is already running near capacity, you have not solved a sustainability problem. You have exported it and potentially made it worse.
Our framework treats grid strain, specifically the load-to-capacity ratio of the destination region, as a hard constraint, not a soft penalty. A migration only happens if the resulting strain stays below a defined safe threshold. This is a different design philosophy from prior carbon-aware or cost-aware schedulers, and it produces meaningfully different outcomes.
How the System Works
The core inputs are three real-world signals pulled hourly from seven U.S. ISOs (CAISO, ERCOT, MISO, NYISO, PJM, SPP, ISO-NE): electricity price in $/kWh, carbon intensity in kg CO2/kWh, and grid strain as a normalized load-to-capacity ratio. We model workloads representative of large language model training: 2TB dataset sizes with realistic inter-region bandwidth and latency assumptions.
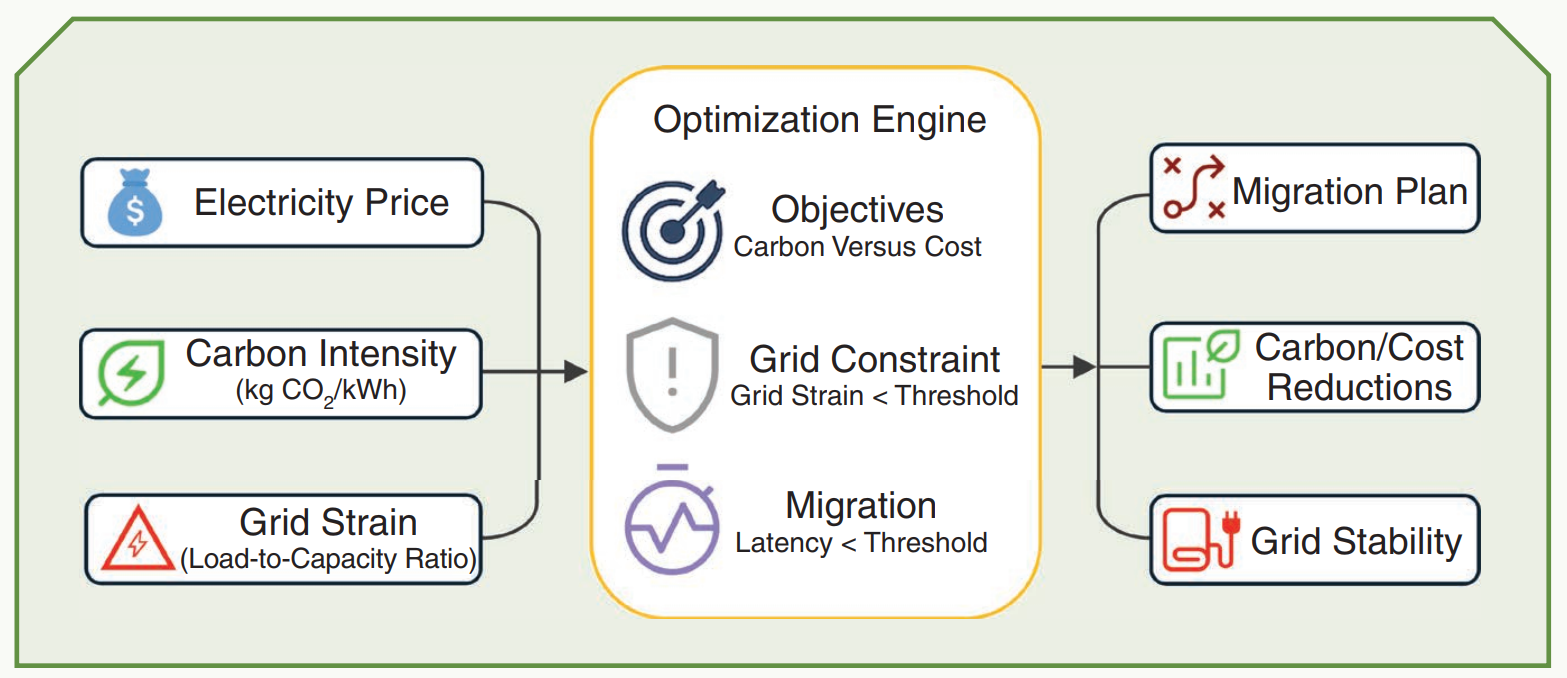
The objective function is a weighted combination: minimize α · Carbon + (1-α) · Cost, where α is tunable. Two hard constraints gate every decision. First, the destination grid strain after migration must stay below a safe threshold. Second, migration latency (workload size divided by available bandwidth) must stay below a performance threshold. If either constraint fails, the migration is blocked. No exceptions.
What makes this different from the naive approach is the explicit separation of concerns: economic and environmental objectives live in the objective function, while grid reliability and workload performance live in the constraints. This means you can never trade grid stability for a better optimization score.
The Migration Path Asymmetry Nobody Talks About
We expected that some migration paths would be better than others. We did not expect the magnitude of asymmetry we found.
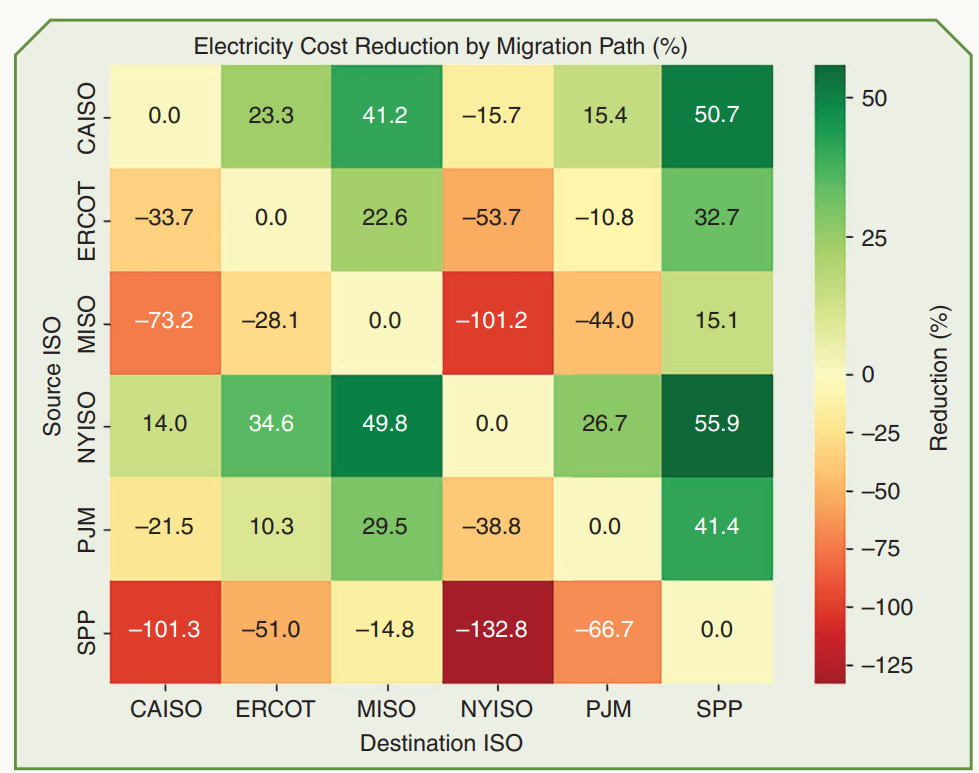
NYISO to SPP saves 55.9%. SPP to NYISO costs 132.8% more. That is not a rounding error or a data artifact. SPP has structurally low electricity prices, which makes it an excellent migration destination. It also means running workloads there already is cheap, so migrating away from SPP to almost anywhere else is expensive. MISO shows a similar pattern: migrating out of MISO to NYISO results in a 101.2% cost increase.
The practical implication is that your default migration heuristics need to be origin-aware. A blanket "migrate to the greenest region" policy applied from SPP will consistently destroy your cost budget.
What Happens When You Tune the Carbon vs. Cost Dial
We ran five configurations ranging from pure cost optimization (α=0, β=1 for cost) to pure carbon optimization (α=0, β=1 for carbon). The tradeoff is real but not as brutal as you might expect.
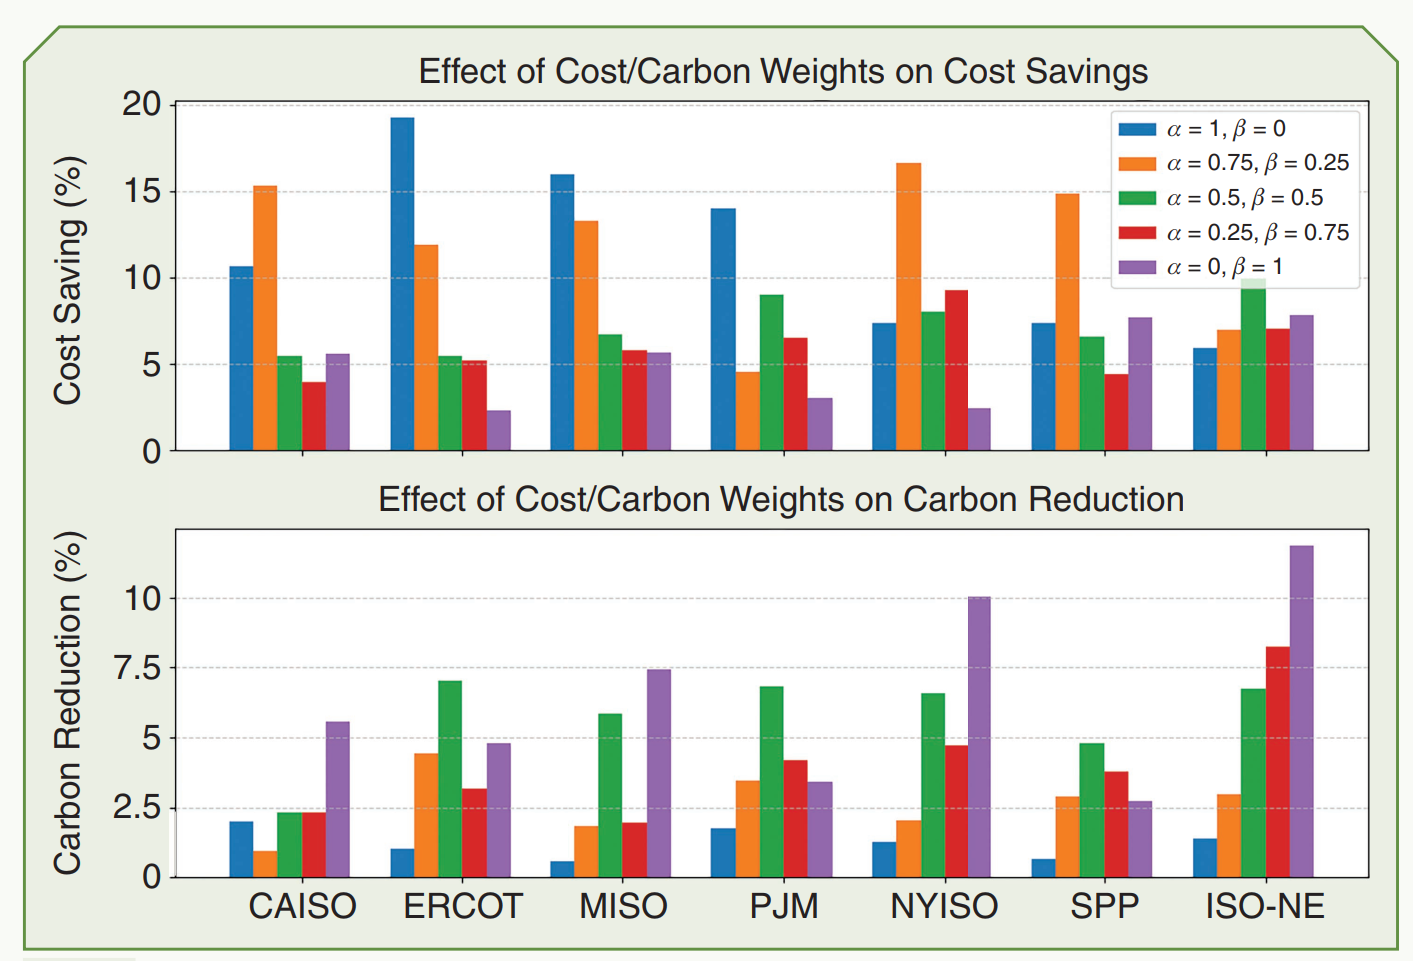
ERCOT achieves nearly 19% cost savings when α=1 (pure cost focus), but that drops to about 2.5% when you flip fully to carbon. ISO-NE achieves 12% carbon reduction when β=1, but the cost savings fall accordingly. The key insight is that the tradeoff is convex and well-behaved. You can operate at intermediate weights (α=0.5, β=0.5) and capture meaningful gains on both dimensions simultaneously. You do not have to pick one.
The other thing we noticed: carbon reduction is harder to squeeze out than cost reduction in most regions. Cost signals in electricity markets are sharp and hourly. Carbon intensity signals are smoother and sometimes weakly correlated with price. That is why pure carbon optimization often delivers lower absolute improvements than pure cost optimization, even when the weights fully prioritize it.
Our Method vs. Baselines: The Grid Strain Story
We benchmarked against three alternatives: Cost-Only, Carbon-Only, and CarbonClipper (a prior method). This is where the uncomfortable math lands.
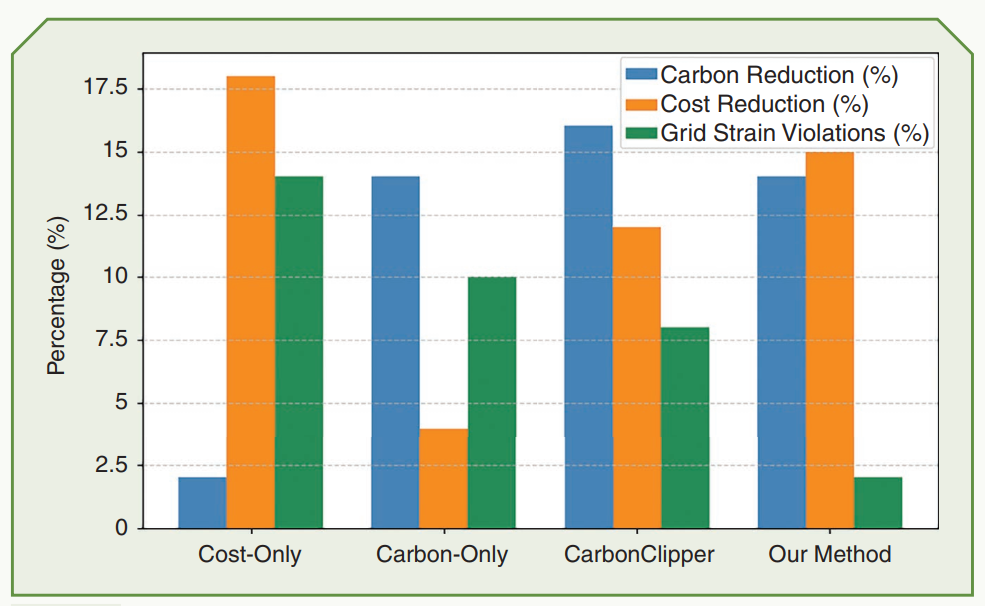
Cost-Only gets 18% cost reduction. It also produces 14% grid strain violations. That means roughly one in seven migrations is pushing a destination region beyond safe operating limits. CarbonClipper achieves strong carbon reduction but still generates 8% violations. Our method lands at 14% carbon reduction, 15% cost reduction, and only 2% grid strain violations.
The delta in cost savings between Cost-Only and Our Method is 3 percentage points. The delta in grid violations is 12 percentage points. That is a trade we would make every time.
Key Results
- ✓Up to 55.9% cost reduction on NYISO-to-SPP paths, but direction matters enormously. Reverse that path and costs increase by 132.8%.
- ✓13% carbon and 15% cost reductions are simultaneously achievable with grid constraints enforced.
- ✓Grid strain violations drop from 14% to 2% when switching from Cost-Only to our constrained formulation, with less than 3% sacrifice in cost savings.
- ✓ISO-NE achieves the highest carbon reduction (12%) under carbon-focused weights, making it the best target for organizations with hard emissions commitments.
- ✓Seasonal and temporal patterns are real. Migration opportunities shift between summer and winter, meaning a static migration policy will systematically miss the best windows.
What We Know, What We Do Not
We are confident that grid strain constraints belong in migration optimizers as hard constraints, not soft penalties. The cost of ignoring them is not abstract: it is measurable violations in every simulation we ran without them.
We are less certain about how these results scale to multi-hop migrations, workload preemption scenarios, or grids outside the U.S. ISO structure. The framework assumes workloads are fungible and fully migratable, which is a reasonable model for batch AI training but breaks down for stateful or latency-sensitive inference serving.
The open question that still interests us: can you predict migration opportunities 4 to 6 hours ahead using grid strain forecasts, and does that lookahead materially improve the optimization? Real-time signals are good. Predictive signals might be better. That is the next thing we would build.